Focus Fonds

Carmignac Sécurité: the Fund Manager’s thought
The monetary and fiscal policies that took shape during the second quarter fully delivered their effects on financial markets in the third.
The assurance that the ECB would unfailingly buy financial assets, combined with the European Union’s pledge to cover part of member states’ financing needs as of 2021, was enough to keep German bond yields steady during the quarter. 5- and 10-year Bunds traded within a 15-basis-point range and ended the quarter practically where they had started, which was –0.50% in the case of 10-year paper. This stability at markedly negative yields was what convinced us to hold no substantial positions in that market segment over the period.
A different picture emerges, however, when you consider other eurozone countries, particularly those offering significant credit spreads at a time of negative interest rates – i.e., Italy, Greece, Portugal, Cyprus and Spain. Bond yields in those countries fell consistently throughout the summer. Those on Italian 10-year issues shrank from 1.3% to almost 0.7%. In response, we at Carmignac Sécurité stayed highly active in this corner of the fixed-income market, beefing up our holdings of sovereigns from Southern Europe and extending the maturities on them to between 5 and 7 years. After the summer rally, we scaled back those positions, notably by selling off the shortest-maturity bonds paying negative yields. At the end of September, Italian sovereign and quasi-sovereign debt accounted for the bulk of our government bond portfolio.
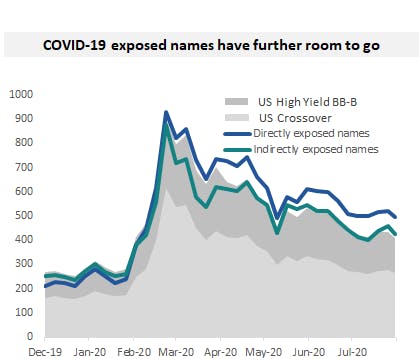
The other big winner in this policy mix has been corporate credit
Despite the unprecedented economic slump, companies managed from early April onwards to secure the funding they needed via primary issues. Our Fund invested extensively in them to access the relatively high yields on offer. Once the worst was over, the low overall level of so-called risk-free rates, combined with central-bank support through asset purchases, made it possible for corporate credit to book solid performance.
-
-
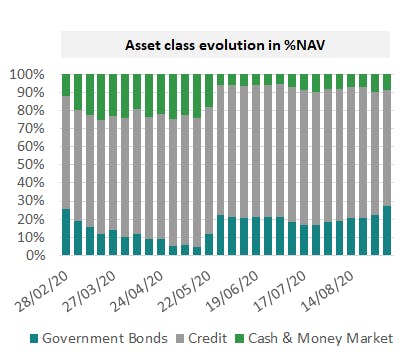
Credit spreads narrowed sharply in July and August, though September was more of a mixed bag. Ever since April, we have been steadily raising our exposure to this kind of debt to a high point at which it accounted for 67% of our total portfolio (not including investments in CLOs). That point was reached at end-July, with that allocation accounting for almost two thirds of the Fund’s total modified duration. From then on, we gradually reduced duration, and more markedly so in late August.
We mainly sold the longest maturities in our portfolio on negative-yielding bonds, as well as on issues that didn’t enjoy direct ECB support (chiefly bank bonds and bonds from non-eurozone issuers). At the same time, we have maintained our strong convictions on companies directly affected by the economic and public health crisis despite having extremely healthy balance sheets, which give them the cushioning needed to weather the storm. Names that come to mind include Easyjet and Airbus in aviation, the Carnival cruise line and Pemex in the energy sector.
-
At end-September, corporate credit accounted for 56% of the Fund’s assets. We made no change to our CLO allocation in the quarter. That asset class has one of the most attractive risk/return profiles in the euro market (particularly on the highest-rated CLOs), which is why we have kept our exposure at around 7.5% of our portfolio. -
In the last quarter of 2020, we will be in for a number of developments that stand a good chance of surprising the market. The US presidential election, Brexit and a possible vaccine all have the potential to make financial asset prices more volatile. By reducing portfolio risk while holding onto several strong convictions, we at Carmignac Sécurité should have the agility required in such an environment.
Carmignac Sécurité AW EUR Acc
| 2014 | 2015 | 2016 | 2017 | 2018 | 2019 | 2020 | 2021 | 2022 | 2023 |
2024 (YTD) ? Depuis le début de l'année |
|
|---|---|---|---|---|---|---|---|---|---|---|---|
| Carmignac Sécurité AW EUR Acc | +1.69 % | +1.12 % | +2.07 % | +0.04 % | -3.00 % | +3.57 % | +2.05 % | +0.22 % | -4.75 % | +4.06 % | +1.41 % |
| Indicateur de référence | +1.83 % | +0.72 % | +0.30 % | -0.39 % | -0.29 % | +0.07 % | -0.15 % | -0.71 % | -4.82 % | +3.40 % | -0.12 % |
Défilez à droite pour voir le tableau dans sa totalité
| 3 ans | 5 ans | 10 ans | |
|---|---|---|---|
| Carmignac Sécurité AW EUR Acc | +0.14 % | +1.12 % | +0.70 % |
| Indicateur de référence | -0.73 % | -0.52 % | -0.11 % |
Défilez à droite pour voir le tableau dans sa totalité
Source : Carmignac au 28/03/2024
| Coûts d'entrée : | 1,00% du montant que vous payez au moment de votre investissement. Il s'agit du maximum que vous serez amené à payer. Carmignac Gestion ne facture pas de frais d'entrée. La personne en charge de la vente du produit vous informera des frais réels. |
| Coûts de sortie : | Nous ne facturons pas de frais de sortie pour ce produit. |
| Frais de gestion et autres frais administratifs et d’exploitation : | 1,11% de la valeur de votre investissement par an. Cette estimation se base sur les coûts réels au cours de l'année dernière. |
| Commissions liées aux résultats : | Aucune commission de performance n'est prélevée pour ce produit. |
| Coûts de transaction : | 0,24% de la valeur de votre investissement par an. Il s'agit d'une estimation des coûts encourus lorsque nous achetons et vendons les investissements sous-jacents au produit. Le montant réel varie en fonction de la quantité que nous achetons et vendons. |
* Keith Ney arrival (22/01/2013). Performance Indicator: EuroMTS 1-3 years index (EUR). Performance of the A EUR acc share class. Past performance is not necessarily indicative of future performance. The return may increase or decrease as a result of currency fluctuations. Performances are net of fees (excluding possible entrance fees charged by the distributor).
Carmignac Sécurité AW EUR Ydis
L'indicateur peut varier de 1 à 7, une catégorie 1 correspondant à un risque plus faible et un rendement potentiellement plus faible et une catégorie 7 correspondant à un risque plus élevé et un rendement potentiellement plus élevé. Une catégorie 4-5-6-7 implique une forte à très forte volatilité, impliquant des fortes à très fortes variations de prix pouvant entraîner des pertes latentes à court terme.
Durée minimum de placement recommandée
Risque plus faible Risque plus élevé
Risques non suffisamment pris en compte par l’indicateur :
RISQUE DE CRÉDIT : Risque que l’émetteur ne puisse pas faire face à ses engagements.
RISQUE DE CONTREPARTIE : Risque de subir des pertes en cas de défaillance d’une contrepartie incapable de faire face à ses obligations contractuelles.
RISQUE LIÉ A L'IMPACT DES TECHNIQUES TELLES QUE LES PRODUITS DÉRIVÉS : Risques de fortes pertes liées à ces instruments.
RISQUE DE LIQUIDITÉ : Risque d'impact des dérèglements de marché ponctuels sur les conditions de prix auxquelles un OPCVM sera amené à liquider, initier ou modifier ses positions.
Risques inhérents :
RISQUE DE CRÉDIT : Risque que l’émetteur ne puisse pas faire face à ses engagements.
RISQUE DE TAUX D’INTÉRÊT : Risque d'une baisse de la valeur liquidative en cas de mouvement des taux d'intérêt.
RISQUE DE CHANGE : Risque lié à l’exposition, via les investissements directs ou l'utilisation d'instruments financiers à terme, à une devise autre que celle de valorisation de l'OPCVM.
RISQUE DE PERTE EN CAPITAL : Cette part/classe ne bénéficie d’aucune garantie ou protection du capital investi. Vous risquez de ne pas récupérer l’entièreté de votre capital investi.
Pour plus d’informations sur les risques de la part/classe, vous devez vous référer au prospectus et plus particulièrement à la section « Profil de risque » ainsi qu’au document d’information clé pour l’investisseur.